

Submitted by Robina Koenig @ Tumble Creek Farm, Bend, Oregon
Happy New Year and I hope everyone had a wonderful 2013 as we look forward to 2014.
As promised, the Micron Testing Project, approved and paid for by the board, was completed within 2013 with the goal of finding the average micron count for the North American Bluefaced Leicester flock. All of our current material reflects UK information. Due to the differences in staple length of the samples from each farm represented here, the Micron Profile graph was not taken into consideration.
A total of 90 samples were submitted from 9 farms for this project. I would like to personally thank those that participated. Your individual reports will be mailed to you shortly. My summary is at the end of these definitions.
Following is a definition of the terms used and are directly from the American Wool Council, a division of the American Sheep Industry Association.
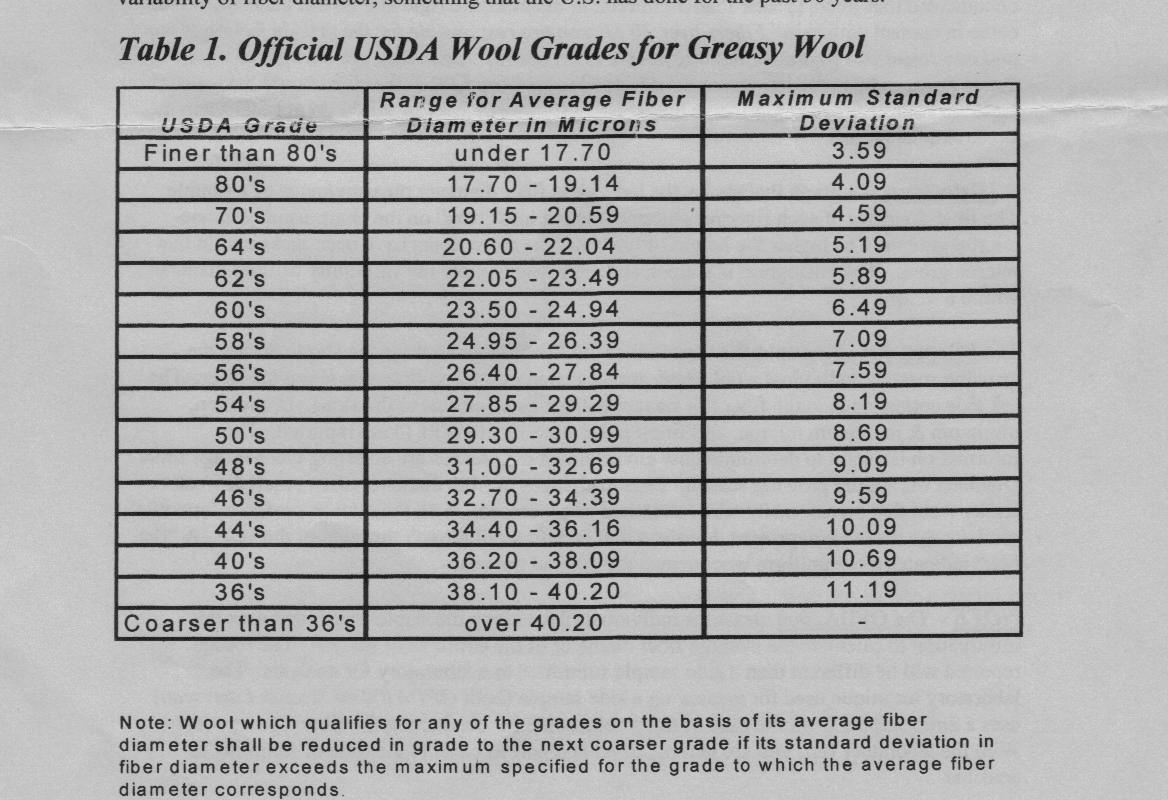
The Average Fiber Diameter (AFD) is the thickness of the wool sample measured in microns. A micron is 1 millionth of a meter or 1/25,400 inches. Average diameter is necessary because a wool fiber does not grow at a uniform thickness on the sheep, and fibers growing next to each other will grow at different rates. It is not uncommon to see fibers with diameters that are 15 microns different (or more) within a single sample. (See Table 1)
Information on AFD and the corresponding USDA wool grade is presented in Table 1. The US is the only country in the world that has an actual fiber diameter measurement in microns associated with its Wool Grades. The USDA wool grade also takes variability of fiber diameter into consideration. Countries such as Australia and New Zealand have only started reporting variability of fiber diameter, something that the US has done for the past 50 years.
Standard Deviation (SD) is a measure of the variation of wool fiber diameter. Statistically speaking, 2/3 of the fibers measured fall with +/- one SD of the Average Fiber Diameter. For example—a sample with an AFD of 22.5 micron and an SD of 4.5 micron would have 2/3’s of the fibers measured between 18 and 27 micron. The other 1/3 of the fibers would be finer than 18 micron or coarser than 27 micron. The smaller the SD, the closer the fibers are to the Average Fiber Diameter, resulting in less variation among the individual fiber diameters for the entire sample.
Because lack of uniformity affects processing performance, the USDA wool grades have a maximum allowable SD for each wool grade (Table 1). If the SD is greater than the maximum allowed, the wool sample is downgraded to the next lower USDA grade. Also, coarser wool tends to be more variable; therefore, the SD allowance increases as the fiber diameter increases.
Coefficient of Variation (CV%) is also a measure of the variability of the sample, but is expressed as a percentage and is relative to the mean or Average Fiber Diameter. The mathematical equation is: CV% = SD/AFD x 100. This measurement is particularly useful because it allows one to compare wools of different fiber diameters. Ideally, the CV% should be 20% or less on an individual animal sample.
Coarse Edge Micron (CEM) provides information on how coarse the top 5% of the fibers are in relationship to the AFD. The smaller the CEM, the more uniform the wool sample. Samples with a high CEM tend to have a “tail” on the Histogram that shows a trailing off of fiber diameter, rather than the desired high peaked, bell shape curve.
Comfort Factor (CF%) is the percentage of fibers equal to or less than 30 micron. It has beeen documented that fibers greater than 30 micron in diameter are rigid and do not bend when they come in contact with skin. Fibers over 30 micron are responsible for the prickly feeling of wool and can cause skin irritation, leading people to erroneously state they are allergic to wool. Wool that is going to be made into garments designed to be worn next to the skin should have a comfort factor of 95% or greater. Garments made with a Comfort Factor of +95% do not feel scrtchy or cause skin irritations.
A Histogram is a graph that shows the individual fiber diameter measurements of a sample. The fiber diameter of each fiber measurement is put into “bars” on the chart, usually in one-micron groups. The higher the height of the “bar” the more fibers have been measured in that micron group. The Histogram is a quick and easy way to view the variability of fiber diameter within a sample.
*The Micron Profile graphs the variation of the fiber diameter along the staple during the growing season. Individual wool fibers are measured every 5 millimeters along the fiber. The left side corresponds to the fiber tip; right side fiber base (closest to the skin). In addition, minimum & maximum micron, the finest point from the tip (FPFT) are reported. This information is useful to determine how environment differences are affecting the Average Fiber Diameter during the growing season. Drastic changes in fiber diameter often result in weak or tender wool that breaks easily when stretched or processed. With the micron profile information, growers can make management decisions that benefit wool growth throughout the year. A “flat line” indicates more uniform wool grown throughout the year.
*The participating farms will see this graph on their individual reports.
NOTE: The OFDA2000 measures individual fibers along the staple length and uses this information to calculate the average fiber diameter of the entire wool sample. The results reported will be different than a side sample submitted to a laboratory for analysis. The laboratory technique used for measuring a side sample (boh OFDA100 or Sirolan Laserscan) uses a 2mm snippet from the base of the wool sample for conducting the fiber diameter test. With a laboratory test, you are getting an AFD report as close to the time of sampling as possible.
TABLE 1
Following is my brief summary of the BFL wool micron test results from Texas A&M, sponsored by BLU in 2013.
Our US flock has used UK genetics via LAI for the past several years. The resulting offspring have been extensively used for breeding as well, increasing the influence of the original elite UK sires and widening our North American Bluefaced Leicester gene pool. One way the results of this infusion of new blood can be evaluated is in our fleeces. While qualities such as handle, crimp and softness are somewhat subjective, micron diameter is measurable data that can be reported precisely and used as a selection tool for the future. Climate plays a part in our fleeces as well, as do feeds grown and fed across the country. All of these must be considered when evaluating and reading micron reports.
Nine North American farms participated in our free micron testing project. There were 90 samples submitted, and it should be noted that there were differing numbers of sheep tested from each farm. The average micron diameter of all animals as a group 27.7. The lowest farm average was 23.9 and the highest was 30.2. Most of the samples were from ewes and only a few rams that I could guess from some names given. I did not notice a reportable difference between them.
I would like to offer a personal comment on the Comfort Factor definition. Bluefaced Leicester wool is not typically thought of as being a ‘close to the skin’ or ‘baby underwear’ wool such as Rambouillet would be. Please keep in mind that the italicized comment in the definition is heard often; however, I wear my BFL in comfort and with pride.
Happy New Year to All. It has been my pleasure to work on this project and I hope you will seek to do your own micron testing of your flock if you were unable to participate.